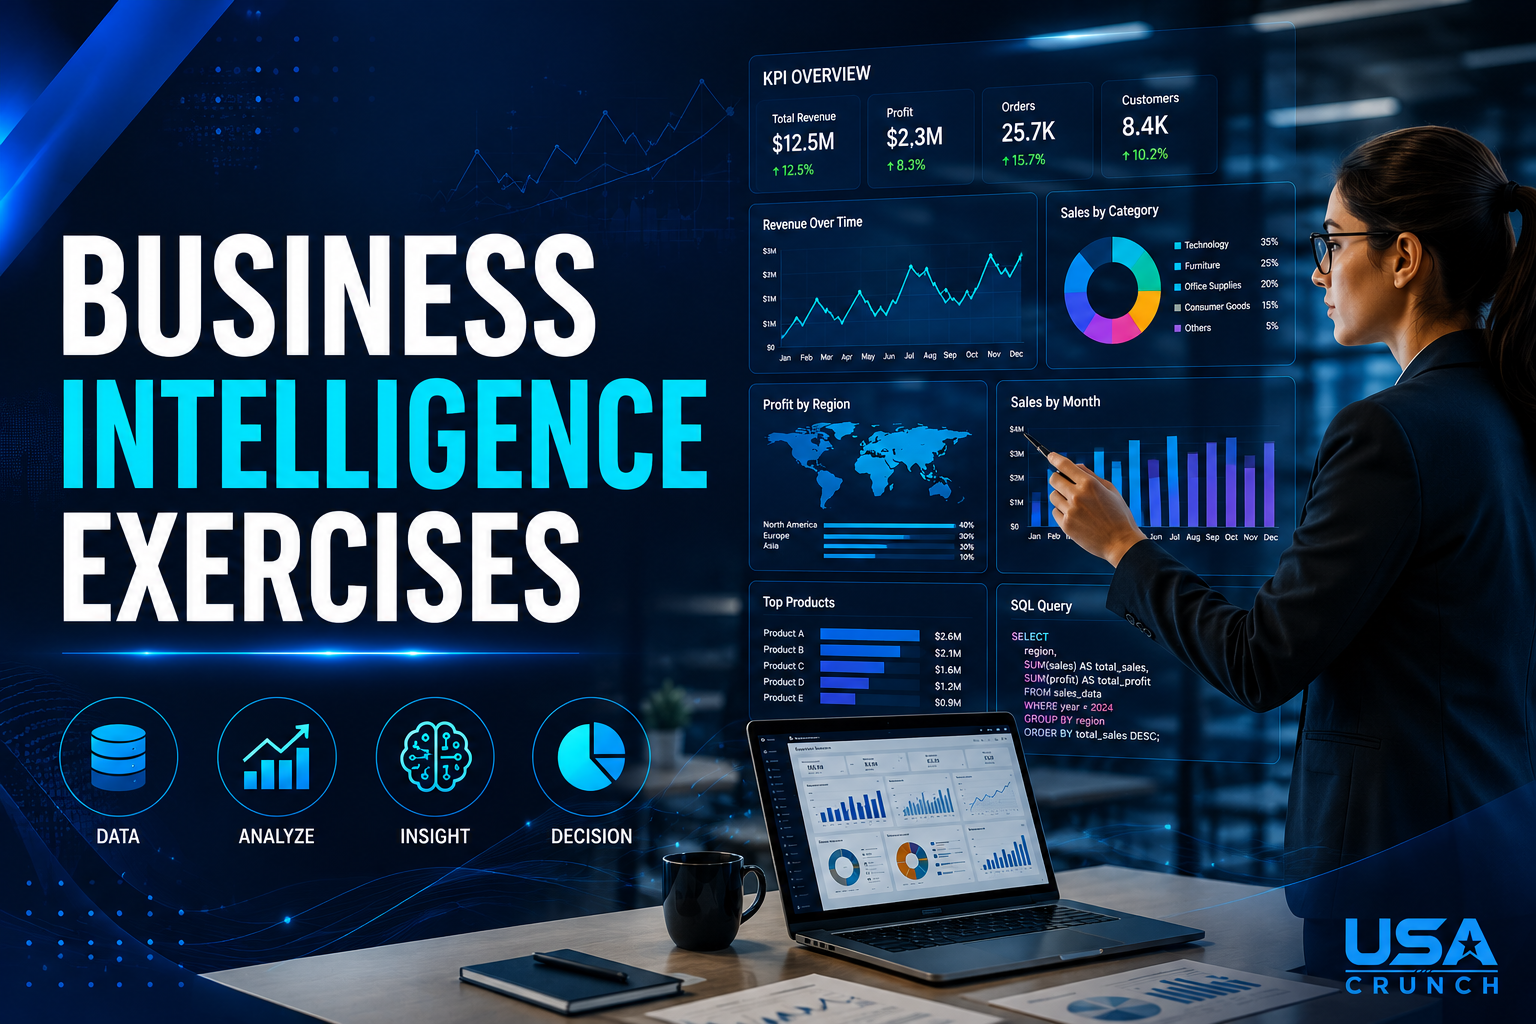
Business Intelligence (BI) has become one of the most valuable skills in today’s data-driven world. Companies rely on professionals who can collect, analyze, and interpret data to make informed business decisions. Whether you’re a student, beginner, or experienced analyst, practicing Business Intelligence Exercises to Build Better Data Skills is the fastest way to strengthen your analytical thinking and technical expertise.
In this guide, you’ll discover practical exercises that improve your understanding of BI tools, dashboards, reporting, data visualization, SQL, Excel, Power BI, Tableau, and more. By consistently practicing these exercises, you’ll gain the confidence needed to solve real business problems using data.
Table of Contents
| Heading |
|---|
| Introduction |
| Why Business Intelligence Skills Matter |
| Exercise 1: Data Cleaning |
| Exercise 2: Excel Dashboards |
| Exercise 3: SQL Practice |
| Exercise 4: Power BI Reports |
| Exercise 5: Tableau Visualizations |
| Exercise 6: KPI Dashboards |
| Exercise 7: Sales Analysis |
| Exercise 8: Customer Segmentation |
| Exercise 9: Financial Reporting |
| Exercise 10: Predictive Analytics |
| Best Learning Resources |
| Common Mistakes |
| FAQs |
| Conclusion |
Business Intelligence Skills Are More Important Than Ever

Modern organizations generate enormous amounts of data every day. However, raw data has little value until it’s transformed into meaningful insights.
Business Intelligence enables organizations to:
- Improve decision-making
- Increase operational efficiency
- Reduce costs
- Predict future trends
- Identify profitable opportunities
- Improve customer satisfaction
Professionals with BI skills are highly sought after because they bridge the gap between raw data and business strategy.
Exercise 1: Clean and Prepare Raw Data

Data cleaning is one of the most important BI skills. Before analysis, datasets usually contain:
- Duplicate rows
- Missing values
- Incorrect formats
- Typographical errors
- Inconsistent categories
Practice by downloading public datasets and correcting these issues.
Skills learned:
- Data validation
- Data transformation
- Error detection
- Standardization
Exercise 2: Build Interactive Excel Dashboards

Excel remains one of the most widely used BI tools.
Create dashboards that include:
- Pivot Tables
- Pivot Charts
- Slicers
- Conditional Formatting
- KPI Cards
- Trend Charts
A good dashboard should answer important business questions within seconds.
Exercise 3: Practice SQL Queries

SQL is the language of data.
Practice writing queries using:
- SELECT
- WHERE
- GROUP BY
- ORDER BY
- HAVING
- JOIN
- CASE
- Aggregate Functions
Challenge yourself with datasets involving customers, products, sales, and inventory.
Exercise 4: Create Power BI Reports

Power BI allows analysts to transform raw data into interactive reports.
Try creating dashboards showing:
- Monthly sales
- Revenue growth
- Customer demographics
- Regional performance
- Product profitability
Experiment with DAX formulas and calculated measures.
Exercise 5: Design Tableau Visualizations

Visualization helps communicate complex insights clearly.
Create:
- Heat maps
- Scatter plots
- Geographic maps
- Treemaps
- Bubble charts
- Story dashboards
Always choose visuals that best represent your data.
Exercise 6: Build KPI Dashboards

Every business measures success through KPIs.
Common KPIs include:
- Revenue
- Profit Margin
- Customer Retention
- Employee Productivity
- Inventory Turnover
- Conversion Rate
Design dashboards that update automatically.
Exercise 7: Analyze Sales Performance

Analyze sales data to answer questions like:
- Which products sell best?
- Which regions perform well?
- What months generate the highest revenue?
- Which customers spend the most?
This exercise strengthens your analytical thinking.
Exercise 8: Customer Segmentation

Divide customers into groups based on:
- Age
- Location
- Income
- Purchase frequency
- Spending habits
Customer segmentation helps businesses personalize marketing campaigns.
Exercise 9: Financial Reporting
Build reports showing:
- Income Statement
- Expenses
- Cash Flow
- Budget vs Actual
- Profitability
Financial reporting develops your understanding of business performance.
Exercise 10: Explore Predictive Analytics
Move beyond historical reporting.
Practice forecasting:
- Sales
- Inventory demand
- Customer churn
- Revenue growth
Even simple forecasting models improve your BI capabilities.
Best Resources to Learn Business Intelligence
Practice using:
- Microsoft Excel
- Microsoft Power BI
- Tableau
- SQL
- Python
- Google Looker Studio
A great place to learn BI concepts is Microsoft Learn:
https://learn.microsoft.com/training/powerplatform/power-bi/
Common Mistakes Beginners Make
Avoid these mistakes:
- Ignoring data quality
- Using too many charts
- Choosing incorrect visualizations
- Forgetting business objectives
- Not validating results
- Overcomplicating dashboards
Simple, clear dashboards are usually the most effective.
Frequently Asked Questions
1. What is Business Intelligence?
Business Intelligence is the process of collecting, analyzing, and visualizing business data to support better decision-making.
2. Which BI tool is best for beginners?
Microsoft Power BI is beginner-friendly and widely used across industries.
3. Do I need coding skills?
Basic SQL helps, but many BI tools provide drag-and-drop interfaces.
4. How long does it take to learn BI?
Most learners develop solid fundamentals within three to six months of regular practice.
5. Is Excel still useful?
Yes. Excel remains one of the most important tools for business analysts worldwide.
6. Where can I practice BI exercises?
You can use public datasets from Kaggle, government open-data portals, and sample datasets included with Power BI and Tableau.
Conclusion:
Practicing Business Intelligence Exercises to Build Better Data Skills is one of the smartest investments you can make in your professional development. From cleaning data and writing SQL queries to designing interactive dashboards in Excel, Power BI, and Tableau, every exercise strengthens your analytical thinking and prepares you for real-world business challenges. By consistently working with datasets, building reports, and interpreting trends, you’ll gain the confidence to transform raw information into actionable insights that drive better decisions. Whether your goal is to become a data analyst, business analyst, or BI developer, these exercises provide a solid foundation for long-term success.